Driving and public transport services in NSW
trips on train and metro services.1
trips on bus services.1
journeys were taken on NSW roads.1
trips on ferry services.1
trips on light rail services.1
registered motor vehicles in NSW.1
How are customers experiencing these services?
We asked customers how well we were delivering on our Customer Commitments based on their experience with driving and public transport services in NSW. Here’s what they said is working well and where we need to improve.
What are we doing well?
The following statements highlight areas that most respondents agree are working well for them.
- I was able to do what I set out to do.
- I was able to reach an outcome.
- The information was simple to understand.
- It was easy to access the information I needed.
- I found it easy to access the service I needed.
Where can we improve?
The following statements highlight areas that need improvement, based on the least number of respondents agreeing with the statements.
- I felt I was able to provide feedback on how the service could be improved to better meet my needs.
- I felt I was able to provide feedback on the service I received.
- They made an effort to see things from my perspective.
- I felt I was listened to.
- They were proactive in keeping me informed.
Here’s what customers told us about driving and public transport services in NSW
- Easy to access
- Act with empathy
- Respect my time
- Explain what to expect
- Resolve the situation
- Engage the community
83% of customers found these services to be easy to access.
71% felt that service staff acted with empathy in their interaction with the service.
75% of customers felt their time was respected.
69% of customers felt the service explained what to expect.
82% of customers felt their situation was resolved.
51% of customers felt the service allowed them to provide feedback.
Case study
Image

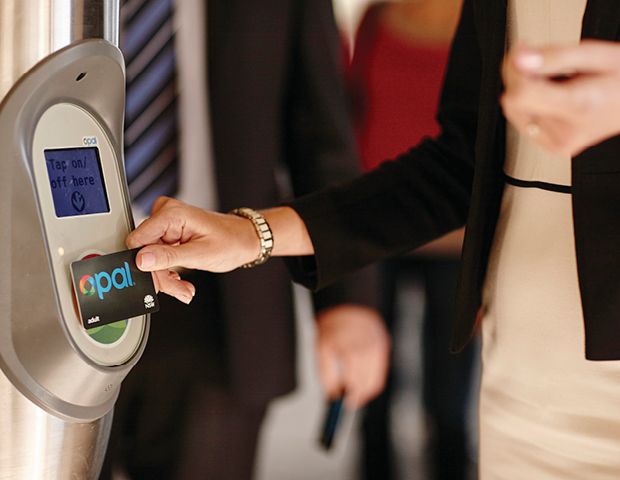
Making it easier to pay for travel on public transport
The Opal digital card trial allowed participants to enjoy a seamless payment experience on public transport using the device they carry with them every day.
Find out more about the report
Source:
1 Transport for NSW Annual Report 2020-21 Volume 1, Transport for NSW.
CXS Source: NSW Government Customer Experience Survey (CXS). About the survey methodology.
Fieldwork: January to June 2022.
Questions: Thinking about your experience with the government service…
- How easy or difficult was it to do this?
- How satisfied or dissatisfied were you with this experience?
- To what extent do you trust the government service to be working in your best interests?
- We would like your opinion on [CUSTOMER COMMITMENT]. Please indicate how strongly you agree or disagree with each of the statements below.
Base: Customers who have interacted with driving and public transport services in the past 12 months.
Sample sizes: Ease and Satisfaction (n=1807), Trust (n=1833), Customer Commitments (various n=1008 to 1833).
Definitions and notes:
- Ease of service is calculated as the percentage of customers that selected ‘Very easy’ or ‘Somewhat easy’.
- Satisfaction with service is calculated as the percentage of customers that selected ‘Very satisfied’ or ‘Somewhat satisfied’.
- Trust in service is calculated as the percentage of customers that selected ‘Trust a great deal’ or ‘Somewhat trust’.
- Responses to the Customer Commitment questions are calculated as the percentage of customers that selected ‘Strongly agree’ or ‘Somewhat agree’ and it excludes ‘Not applicable’ responses.


